Nanohertz gravitational waves—a new probe of the matter distribution of Milky way galaxy
Nanohertz gravitational-wave (GW) signals arise from the superposition of countless low-frequency, long-period sources. Theoretically, their primary origins include the mergers of supermassive black-hole binaries and certain phase transitions in the early Universe. Because nanohertz GWs have wavelengths spanning light‑years, detecting them is highly challenging.
Currently, pulsar timing arrays (PTAs) provide the main detection method. A PTA consists of multiple millisecond pulsars, each emitting extremely regular radio pulses—one per stellar rotation. A passing GW perturbs spacetime and shifts the pulse arrival times at Earth. By precisely measuring these timing residuals, PTAs can probe the nanohertz GW background.
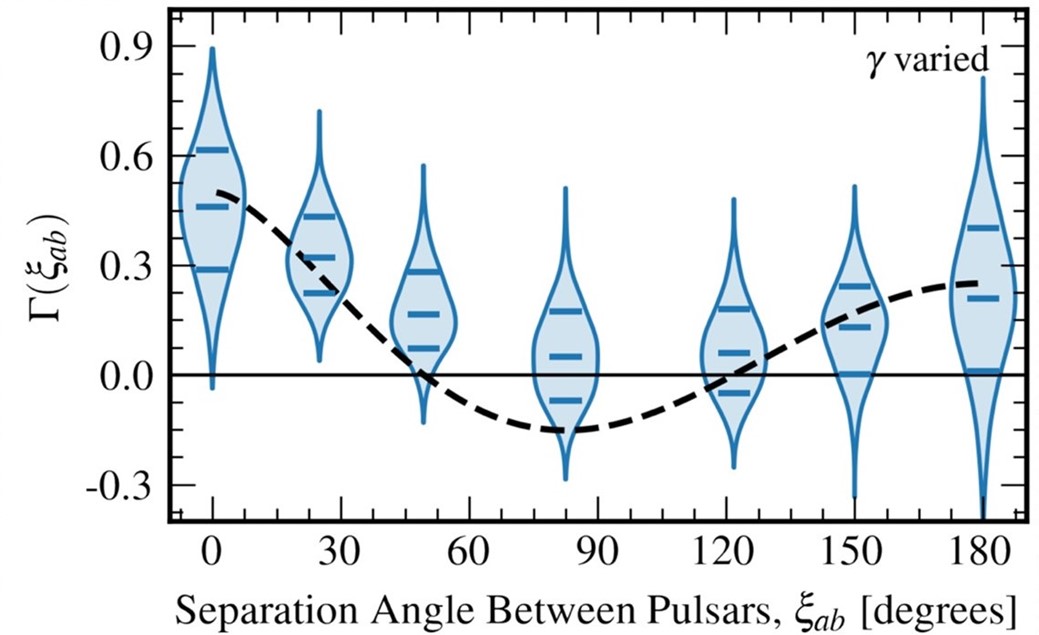
In 2023, the NANOGrav, PPTA, EPTA and CPTA collaborations jointly reported evidence for a nanohertz GW signal, a milestone that bolstered confidence in its existence and spurred further study. However, these data reveal a systematic deviation from the Hellings–Downs correlation curve predicted by general relativity. Similar discrepancies appear in the PPTA, EPTA and CPTA datasets.

One proposed explanation invokes additional GW polarization modes beyond the two transverse modes of general relativity—predicted by some modified gravity theories—which can better fit the measured correlation. To date, the PTA data remain inconclusive on this point.
In this project, we propose a novel perspective: current PTA analyses assume an isotropic GW background, neglecting potential anisotropies induced by the inhomogeneous matter distribution of the Milky Way. In reality, the Galactic mass—dark matter halo, stellar disk and bulge, gas and dust—acts as a gravitational lens, imprinting anisotropy on the stochastic GW field. We will compute this effect and derive an anisotropic Hellings–Downs curve that can more accurately interpret existing PTA observations.
The Hellings–Downs function $\chi(\zeta)$, representing the expected cross-correlation of timing residuals between pulsars separated by angle $\zeta$, is derived from the integral
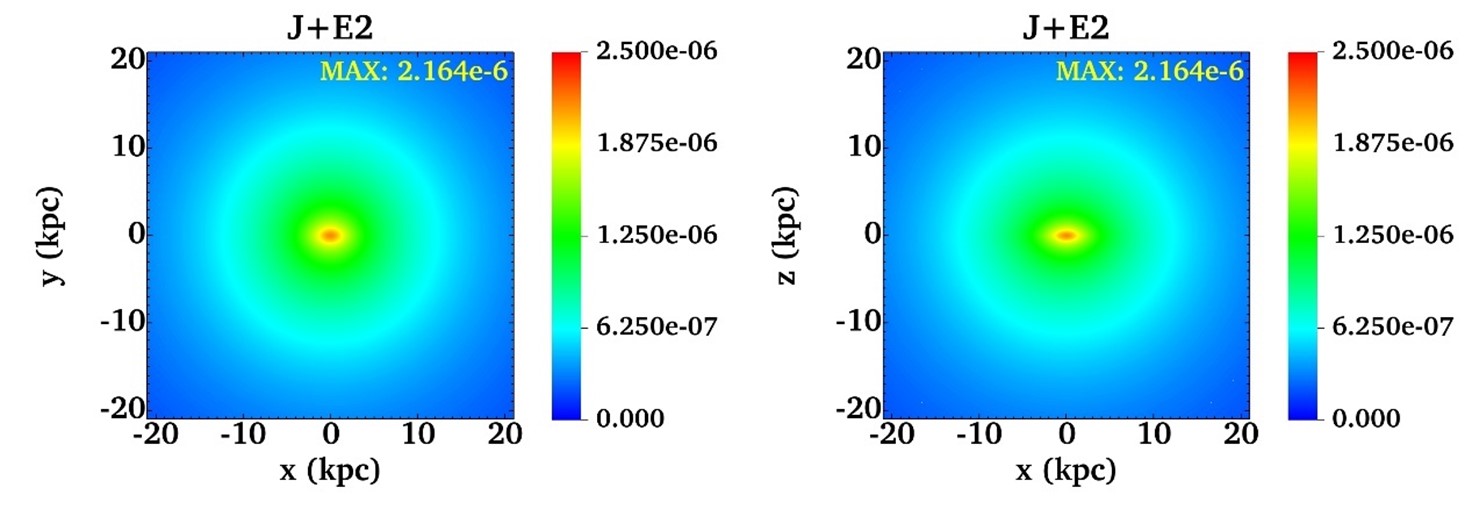
\[\chi(\zeta) \;=\;\frac{1}{8\pi}\int_{S^2} f(\hat{\mathbf{k}})\sum_{\alpha=+,\times} \frac{(\hat{\mathbf{u}}_1\otimes\hat{\mathbf{u}}_1):( \boldsymbol{\epsilon}_\alpha )}{1+\hat{\mathbf{k}}\cdot\hat{\mathbf{u}}_1} \frac{(\hat{\mathbf{u}}_2\otimes\hat{\mathbf{u}}_2):( \boldsymbol{\epsilon}_\alpha )}{1+\hat{\mathbf{k}}\cdot\hat{\mathbf{u}}_2} \,\mathrm{d}^2\Omega_{\hat{\mathbf{k}}},\]where $f(\hat{\mathbf{k}})$ describes the anisotropic GW intensity distribution. While the isotropic case $f=1$ yields the classic Hellings–Downs curve, our project numerically computes $\chi(\zeta)$ for an anisotropic $f(\hat{\mathbf{k}})$ derived from the Galactic mass model. This model incorporates the Milky Way’s multi-component structure (dark-matter halo, stellar disk/halo, interstellar gas/dust) through a three-dimensional mass distribution $\rho(\mathbf{r})$, from which we solve Poisson’s equation
\[\nabla^2\Phi=4\pi G\,\rho(\mathbf{r})\]via finite-element methods (FEM) using the deal.II library.

The gravitational potential $\Phi(\mathbf{r})$ enables geometric-optics calculations of GW lensing magnification along celestial directions $\hat{\mathbf{k}}$, ultimately generating the anisotropic $f(\hat{\mathbf{k}})$.
